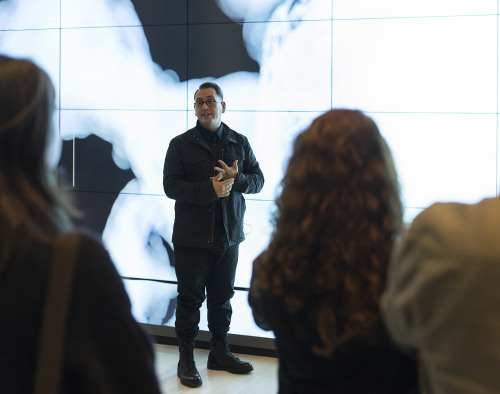
Artist Refik Anadol; ANAMED Director Chris Roosevelt; Duygu Tarkan, Curator of ANAMED’s latest exhibition “The Curious Case of Çatalhöyük” and Şeyda Çetin, its coordinator, talk about Anadol’s media installation commissioned as part of the exhibition.
RA: This is how it all started. Our initial questions were: “How to apply machine-learning to this amazing archive? How to apply deep learning algorithms to get something that is different than a human vision? How to get value from this rich database?” The team that developed the database was also keen on and excited about all these questions. But, there were some practical difficulties. We had a talk about the process with Dominik Lucas who had developed the database. On the other hand, we have been working on the project as a five-person team, together with a data scientist, a VR (virtual reality) engineer, and generative designers who are all presently at our studio. Data mining took a long time because the data had become something that every new researcher reinterpreted over and over again. There are over 900 or so CSV (comma-separated values) files, which means that the data has been interpreted over 900 times by the computer. And the column structure of each one of these was interpreted according to the method employed by each person. In other words, every team had steered the data in a new direction.
DT: In fact, when you say it was created separately, you are talking about the “queries” that we extract from the database, right?
RA: Yes, yes. So, there is no big picture data, actually. After all, the idea of embedding the entire archive into a file with a single click, did not work. This is an exquisite problem. If we look at it from the point of view of computer science, the data was all over the place, this is a good motive. Everyone had added their own interpretation, which also is a good motive. Then we asked, “how it could be possible for a machine to read this?” What do we have to do for it to be able to read this? Considering the photographs have a high resolution, the whole image archive is sufficient and strong; there is already enough information because everything was well documented.
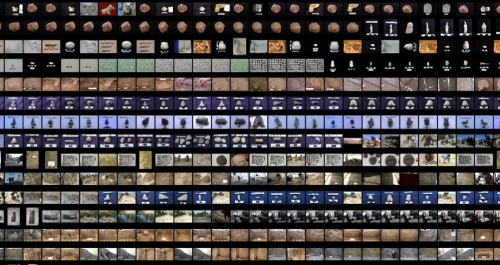
Contact Sheet: Gridified Image Archive, Refik Anadol, Çatalhöyük Research Project Archive, 2017
Although the background colors are different, some people used white and others used black. In each situation, everyone opted to produce something else on the spur of the moment, but the information necessary for “computer vision” is there. Then, there was another challenge. Among all these photographs there is a wide resolution gap between 2006 and 2016. There are very small, 640- to 480-pixel, photographs, while the new ones have gone up to, let’s say, 7,000 pixels. So the difference is extreme. We had to take all these photographs and one by one restore the images and fix them. Then, we had to write an algorithm.
Refik Anadol, Çatalhöyük Research Project Archive, 2017
RA: This is actually a “contact sheet” scene. We arranged these photographs chronologically from left to right in accordance with the mentality of shooting photographs employed by the groups working at the excavation house. Thus, the first photograph shot is located at the top left and the last shot is located at the bottom right. It actually looked quite interesting on the poster, because it also exposed the work in a linear fashion. In fact, we didn’t have to apply a complex type of machine intelligence here. It was just arranged in a historical sequence. For instance, this was a process that took 3 days on its own. The whole archive was processed by finding each image, resizing it to make it smaller, placing this somewhere, making it even smaller once more, placing that somewhere, and then arranging the whole lot from the top left to the bottom right, according to the given dimensions of the installation, and by examining them pixel by pixel. This was a really time-consuming process in itself. Then, we wondered if we could reduce the same data to a single file with Java in processing. We considered if it would be possible to look at the images once again by accessing the metadata and by artificially creating a synthetic metadata.
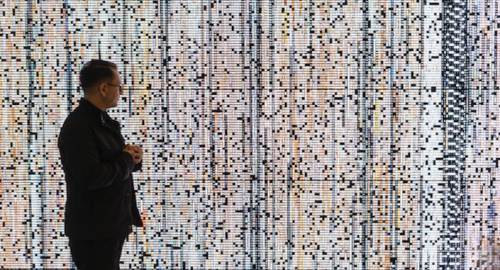
CSV Agents: Agent Metadata Computation, Refik Anadol, Çatalhöyük Research Project Archive, 2017
ŞÇ: In that case, what we see here are again images, that is to say, we are still looking at the relationships between photographs in the archive in this scene.
RA: Yes. Each cube is a data point.
CR: What do you mean when you say, “a data point?” Is that a single photograph?
RA: It is a photograph. Apart from the images, it is possible to decipher the data conclusively in a textual dimension, but that ended up being very limited. The visual data, when considered as something that both we and the machine could see, could be contextualized with relative ease. And what this scene actually asks is this: Can we create such a universe?
CR: Indeed. It reminds one of a wormhole in the universe. So, the length of the tube is chronological? If the tube is chronological, what makes it round? Is it by design?
RA: Yes. If you look from the top view, you’re seeing that. That is an artistic element. But I think it would be also one of the reasons to make it a little bit immersive. It could have been much bigger than that. But then I realized that the overlaps are so much. We couldn’t perceive individual experience of each point, literally, perception-wise.
There are moments that we draw each point from a CSV. So that, each cube has one data point and each data point has one CSV file that the archive is saying something about. And, we just wrote them to make this structural space.
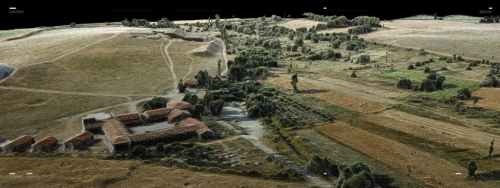
Intro Scene: UAV Mesh of Site, Refik Anadol, Çatalhöyük Research Project Archive, 2017
RA: And here, photogrammetry was attempted, with a drone. Then, it was transformed into a “mesh”. This is a very nice work. A lot of time was spent on it. So, I said, if we are applying machine intelligence to a place like this, it’s cliché; how would we see the space having a 2D-3D visuality through a machine’s perspective? I thought, this is how a machine would see it.
ŞÇ: Does the net on top of the land here indicate the topographical differences?
RA: They show the differences in elevation. This is a 3D scan from a photograph using photogrammetry. This is a very successful attempt. The colour scale was removed, and it is a very low-res topographic image of course. But aesthetically, I think it’s beautiful.
ŞÇ: This, with those nets and that pointillist appearance that indicates topography, is almost like a Paul Signac canvas. When I first saw it, I thought that at the end of the day a digital image has really taken on the aesthetics of a painting.
RA: That’s wonderful. So, you had the same inspiration as you initially saw it. By the way, it took a very long time. It’s not an easy file to work with; there is a mass of high-resolution images on it. Even a simple cinematographic upgrade by hovering a camera above it, turned out to be a two-day process. There was an unexpected duty attached to picking up the texture properly, setting up the camera and making a new reading of the topography in 3D. It looked easy, but this was pretty enjoyable anyway.
ŞÇ: In fact, when I saw what you had managed to achieve, I said, “I don’t believe it. How comprehensive a study of the archive he carried out?” Because we handed over an enormously large database to you, without the aid of a guide. So, you dug into the archive literally.
RA: The first question is, “Where is this excavation site exactly?” You can see the space physically or feel a geographic connection and context. I think starting this experience with that question was a kind of prologue.
What we see next is, interestingly, the same landscape, the same topography where the data is excavated. Because it took this shape, we used a software called “Houdini.” It’s a very complex 3D procedural design software that can handle multi-million points. So in this scale we have around 1.1 million individual points that came from CSV files. Sometimes they are just images, but sometimes they represent information that is unique.
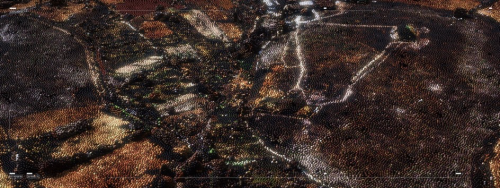
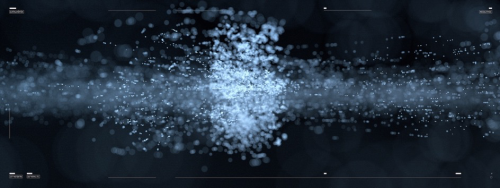
Stanford t-SNE Pan: ARCGIS Site Map, Refik Anadol, Çatalhöyük Research Project Archive, 2017
RA: Here, the color comes from the previous scene, yet at the end each point is a simplification of one unique datum from the archive. Later, with this camera, I was trying to express the vastness and enormity of the landscape in that context. So, the algorithm we used here is “t-SNE.” To explain it simply, it gets the closest proximity relations between millions of data points.
Initially you need to divide the whole archive into 256 – 256 pixels. Every image has to be located perfectly in a square. Then, the embedding number is usually a figure like 1024; data large enough to display large-scale images. When we apply each one of them over and over again, it’s actually a 1004 dimension. It is in fact a big enough data. It is very likely that we have a finding.
CR: This seems like principle components analysis.
Site Lerp: Vectorization of Orthomosaic, Refik Anadol, Çatalhöyük Research Project Archive, 2017
RA: Yes. Later on, the points we see here are transformed into a “t-SNE” group through an algorithm called “landscape lerp.” This transformation is a very interesting point because in the next sequence that landscape is transformed into such a form. What we are seeing here has 50 perplexities. And, perplexity could be explained as the sharpness of that algorithm. It is a range of numbers from 5 to 50 and it can be used in increments of 5. We realized that 50 could provide us with a separation of the most scattered and clustered connections. For instance, five was too muddled, 20 – 25 was still in-between, but at 50 disconnected findings start to emerge. However, this creates a very loaded file. So, plotting a zoom in or a zoom out data would have been a process that would have taken another month. We examined whether it was possible to do a very fast zoom in through which we could artistically capture a poetic visual. For instance, this scene took five days to create. Just this scene. And between each data point, between each of the connection types there is some significance for the researchers.
Refik Anadol, Çatalhöyük Research Project Archive, 2017
CR: Could we think of this as a 3-dimensional cluster analysis, network analysis?
ŞÇ: And here you are still using the data from the first scene that we saw, right? Can we say that this is the entire database?
RA: Exactly. All the data saved as an image in the database are here, all the files having jpeg, tiff, gif, nef, raw file extensions…
DT: Does it also include all the information that was entered while saving the image? I mean, are we seeing the relationships with the information, such as the descriptions, units, features that were also entered into the database?
RA: They are there too. Of course, we cannot see how much of these had such information entered or if they were done in a consistent manner. Because there are 500 thousand points, the more consistent the research, the more consistent the structure. From there, you will get a network tree.
ŞÇ: In this scene too, through the image, we are seeing all the information connected to it, are we not?
RA: Yes, exactly. Because there was only one file that Dominik could provide, so we could at least say that a big picture CSV was present only for the images.
CR: It’s still relating the data associated with images or everything?
RA: Images. But everything about the images.
CR: So all the metadata associated with them but also it’s all the visual data.
RA: To sum up, this is all of the image’s data that already exists in the database. Dominik sent one file that was, I think, 400 megabytes, the file shows every single image that was somehow sorted by someone over the last 20 years. I think 1996 was the first item that is appropriate. Columns and lots of information.
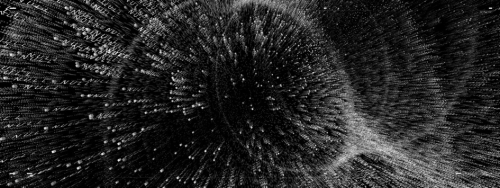
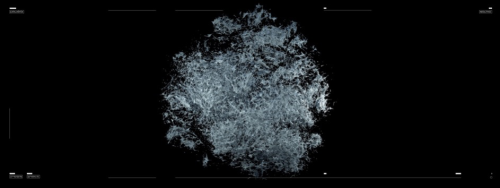
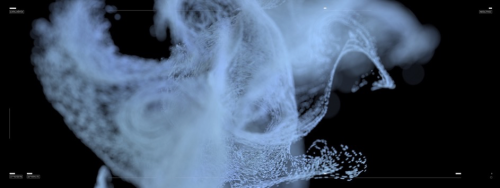
Vortex t-SNE: Nonlinear Dimestionality Reduction, Refik Anadol, Çatalhöyük Research Project Archive, 2017
RA: This is simply that cluster, one result of 50 perplex connections between the images. It was pretty fun to try. I just wanted to see what happens if someone dissipates this entire archive into the data universe. It’s like a very galactic feeling. It is a vortex algorithm applied to the same data universe. Right now, they are just points, not connections. Previously we were seeing the connections. Now they are just individual items in the void. It is an epic experience. The density of the information is going to void…
CR: It is very sad for the archaeologists to experience it all going away…
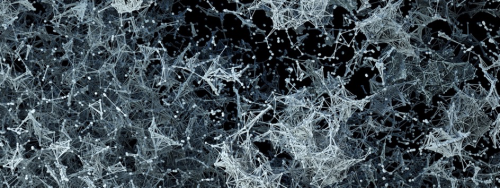
Refik Anadol, Çatalhöyük Research Project Archive, 2017
RA: But then, another jump cut is the turbulence applied. It’s this kind of finding. This can be frozen. It can be a sculpture, it could be VRP (Virtual Reality Prototype) etc. You are seeing the same information in a more poetic fashion. After the corridor, this gives a very ethereal feeling.
CR: It’s very organic. Like a jellyfish… Like sea creatures…
RA: By the way, it’s a very non-linear experience. One can see it starting from any part of it. It doesn’t have an ending. But I think it was very rewarding to put a scene like this, just to appreciate how humongous this data set is. Also the sound we’re hearing is all created from the same data set. My friend Kerim Karaoğlu, from Folkwang Academy, has been collaborating with us for the last six years. A harmony or some sonic clarification is very important instead of just putting ambiguity to the sound. I mean, it is so easy to make a very, let’s say, poetic sound, but it’s very hard to make it from the same data set. This is called “Pure Data (Pd).” It’s a software that uses those CSV files to find those patterns. We have collaborated with Kerim a lot. What is the tone for each scene? He is from Folkwang University in Essen and his education is heavily based on electronic composition in music. He always pushes the limits, as a department they are very unique in this field. He represents that movement in musical thinking.
ŞÇ: So, did he also use the whole archive to compose a sound for your visual experience?
RA: Yes. Dominik shared the CSV files we represent, and the composition literally represents the files. The reason the sound and visuals are very synced is truly because it’s the same data read while processing the same visuals. We’re seeing and hearing a very parallel moment of a machine. It was a pure experiment. It turned out to be very uncanny as well as a complementary experience.
If we have time, in another exhibition, each piece could be an individual experience because each of them are very different experiences. It’s a mash-up of many ideas. It’s the same universe from different points of view. So interesting, how machine intelligence has the vision and sonification of the same space. It becomes more tangible, interestingly. Seeing this in VR would also be mind-blowing.
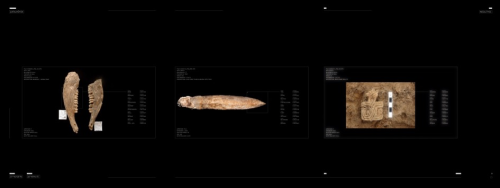
Object Detection:
RA: Okay, this is the part; I’m calling it the exhibition part. We made a model. We had limited time and sources and we needed to make everything promissory. Creating the inputs was our first step. We already created the t-SNE algorithm. We simply went through the categories that Dominik already defined. Then we grouped them based on the t-SNE groups and fed the same input as a model into the cloud, which took another week.
CR: The key here is that the input has to have another metadata associated with it, right?
RA: Exactly. Which was already mostly there. And assuming they are correct, the model becomes the absolute reality of the input. We have a prediction model. And we applied the same models to the entire archive. The scene here represents how insanely accurate the numbers are. 0.9 for AI (artificial intelligence) is a number that is very successful. It is a quicker speed than human perception and vision. Sad but true, sorry. Other good things; I think the findings are so unique even the machine is predicting many things. We just cut to 0.85 confidence because it is already higher than human vision. Those are the scenes what the AI did there. How did it work? For future thinking it can be an application that defines these on the field while you are researching from a very artistic point of view, not like a pro-computer scientist. We had a very humble personal journey. I’m sure in the hands of some complex CS minds it can be very easy. It needs a lot of time and dedication in the same context. Seeing a machine detecting these moments and defining; the confidence levels are very high. I think it can provide fantastic opportunities.
If we look at these 10 scenarios altogether, each scene was an exciting experiment for me too. What happens if we deconstruct linear boring experience into maybe a chapter, then say something different for each one. I must also note the significance of our using an open source code. Everything is open source.
DT: What’s more, the work also coincides with all the ideas of the Çatalhöyük Research Project.
ŞÇ: It’s like Ian Hodder’s theory of “Entanglement” taking on a bodily form. On the cover of his book, Entangled: An Archaeology of the Relationships between Humans and Things where he presents this theory, he also used a net much like the one in the third scene.
DT: Everything that we have talked about in this conversation, like the principle component, network analysis, etc. is actually also done on the information production aspect of the work. These are part of the archaeological research dimension of the work. To be able to transform this once again with an artistic approach is very interesting. Having worked at Çatalhöyük for 13 years, I am one of those people who were making the data entries. I am part of that complex network. But having seen it this way in front of me, I find it fascinating. And the question that we posed as our starting point was that “we have an extremely enormous amount of data concerning Çatalhöyük, how can we display this in the exhibition?” How can we include the theory of entanglement in this narrative? This turned out to be such a comprehensive form of expression that we were very impressed when we saw the initial results.
RA: The data is enormous. A good amount of time had been spent on it. It has the potential to be used in a multitude of ways.
DT: Yes, from the very beginning the database was established so that it would be open to experimental applications. It was conceived not only to answer to the needs of archaeological research, but also to act as a source for interdisciplinary works.
RA: Both archaeologically and anthropologically, having a big database as an insightful machine could mean that machines can become our collaborators in this scale. Imagine people seeing this work, this exhibition 50 years from now. It is a bit uncanny. What happens after 2 or 3 centuries? If we apply machine intelligence now, we could have much bigger potential for society.
CR: Concerning the polymeric display of the networks, it’s fantastic. Drawing from your artistic experience and knowledge, a synergy could be applied again to the same database from a research-question standpoint. Zooming into a specific part and actually looking at what it means? With respect to archaeological data, this would be a fantastic opportunity.